
 Interactive Sudbury Real Estate AI.
Click the link to the left to access our interactive AI who will be happy to answer any questions you may have about the Sudbury market. Unlike other LLMs, our AI only uses sources provided by Terry Riddoch. If he doesn't know the answer he will say - so no mix ups with Sudbury England, Sudbury USA ... the other Sudbury England. You get the picture. Just the Nickle City. NOTE: You will need to login to your Gmail or Google account. .
2025 Market Review: Strategic Insights for Multifamily Investors in Sudbury
Executive Summary: Key Performance Indicators
- Transaction Volume: 36 sold transactions were recorded for the year.
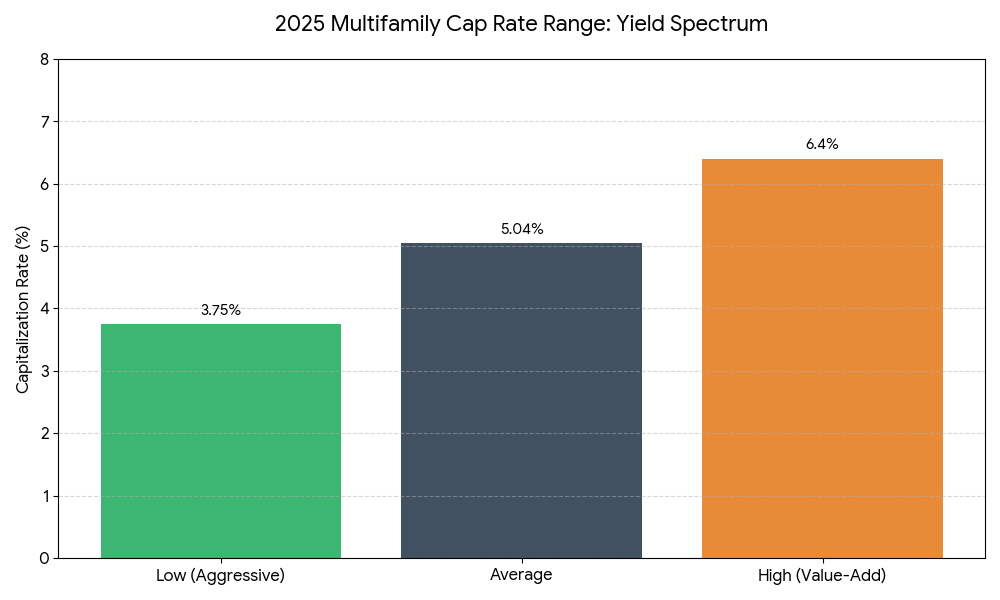
- Average Cap Rate: 5.04%.
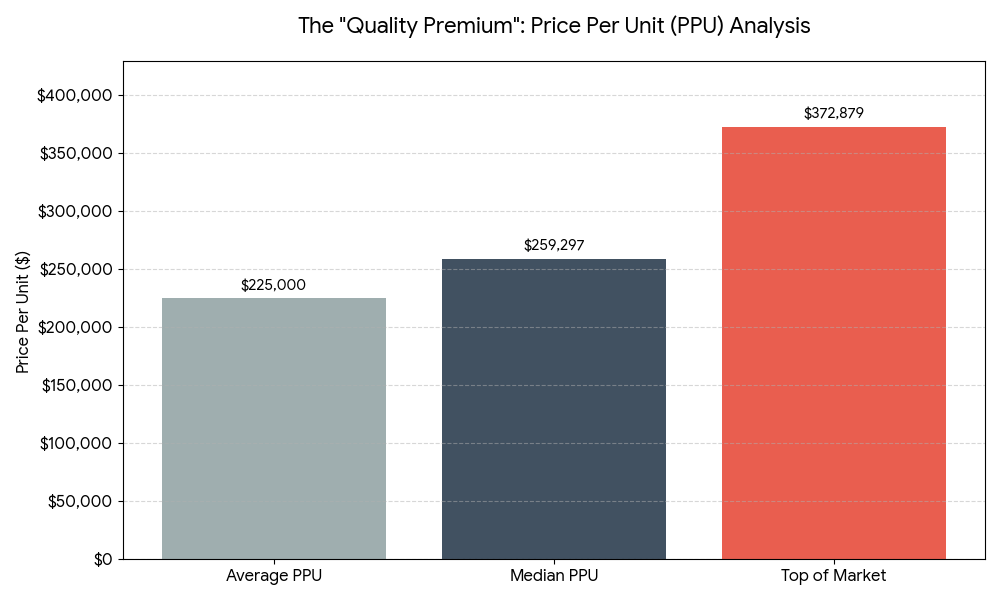
- Median Price Per Unit: $259,297.
- Yield Spread: Cap rates ranged from a low of 3.75% to a high of 6.40%.
- Price Per Unit (PPU): The spread in unit pricing was significant, reflecting a diverse mix of inventory from value-add opportunities to core assets. While the average PPU stood at $225,000, the median reached 372,879 per unit.
- Capitalization Rates: Investors accepted tight yields in exchange for stability. The median actual cap rate was 5.24%, with an average of 5.04%. The presence of sub-4% cap rates (low of 3.75%) highlights aggressive bidding for trophy assets or value-add plays with significant upside potential.
Market Momentum and Capital Flow
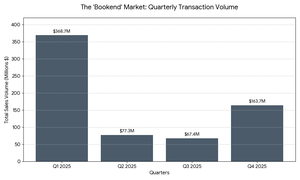 • Q1 Dominance: The year began with an explosion of activity. The first quarter alone recorded over $368 million in total sales volume across all sectors—more than 50% of the year's total volume.
- Mid-Year Cooling & Q4 Rebound: Activity moderated significantly in Q2 ($67 million). However, Q4 saw a resurgence with $163 million in volume, closing the year on a strong trajectory.
- Yield Fluctuations: Broader market cap rates decompressed slightly during the slower Q3 period (rising to 5.72% across all sectors) before compressing again to 4.80% in Q4 as volume returned.
Sector Comparison Context
- Multifamily vs. Office: The office sector was virtually dormant, with only 1 sold transaction recorded.
- Multifamily vs. Retail: General Retail saw moderate activity with 22 sold transactions, but traded at a significantly lower average price per square foot compared to the premium pricing seen in residential assets
Investor Takeaway
Your Sudbury Investment Strategy
Navigating investment properties in the Ontario real estate market requires professional expertise.
Terry Riddoch With 17 years of experience as a broker, Terry has closed over $100 million in commercial deals and ranks #53 in Canada for commercial real estate transactions.
Whether you are looking to acquire a turnkey premium asset, identify an off-market value-add opportunity, or precisely price an investment property you wish to sell, Terry provides the data and strategic guidance necessary to maximize your returns.
Who you work with matters. Partner with an expert who understands the complexities of multi-family real estate.
Check out this article next