
When analyzing commercial real estate investments, the Capitalization Rate (Cap Rate) is arguably the most referenced metric for determining a property's value and potential yield. However, when you look closely at market data, you will often notice a significant gap between the "Market" Cap Rate and the "Transaction" Cap Rate.
Understanding the difference between these two figures is crucial for anyone looking to buy, sell, or accurately underwrite a property. Let's break down what each term means and look at real-world examples of why they rarely match up perfectly.
The Basics: How Cap Rates Work
A cap rate represents a property’s annual rate of return, calculated by dividing the property’s Net Operating Income (NOI) by its purchase price. Because the purchase price is on the bottom of that equation, price and cap rate have an inverse relationship: if you negotiate a lower purchase price for a building with steady income, your cap rate (your yield) increases.
The Baseline: Market Cap Rates
The Market Cap Rate is the theoretical average yield of all properties in a specific asset class and region, including the vast majority of buildings that are happily sitting in landlords' portfolios and are not actively for sale. It represents the baseline health, perceived value, and stabilized yield of the market.
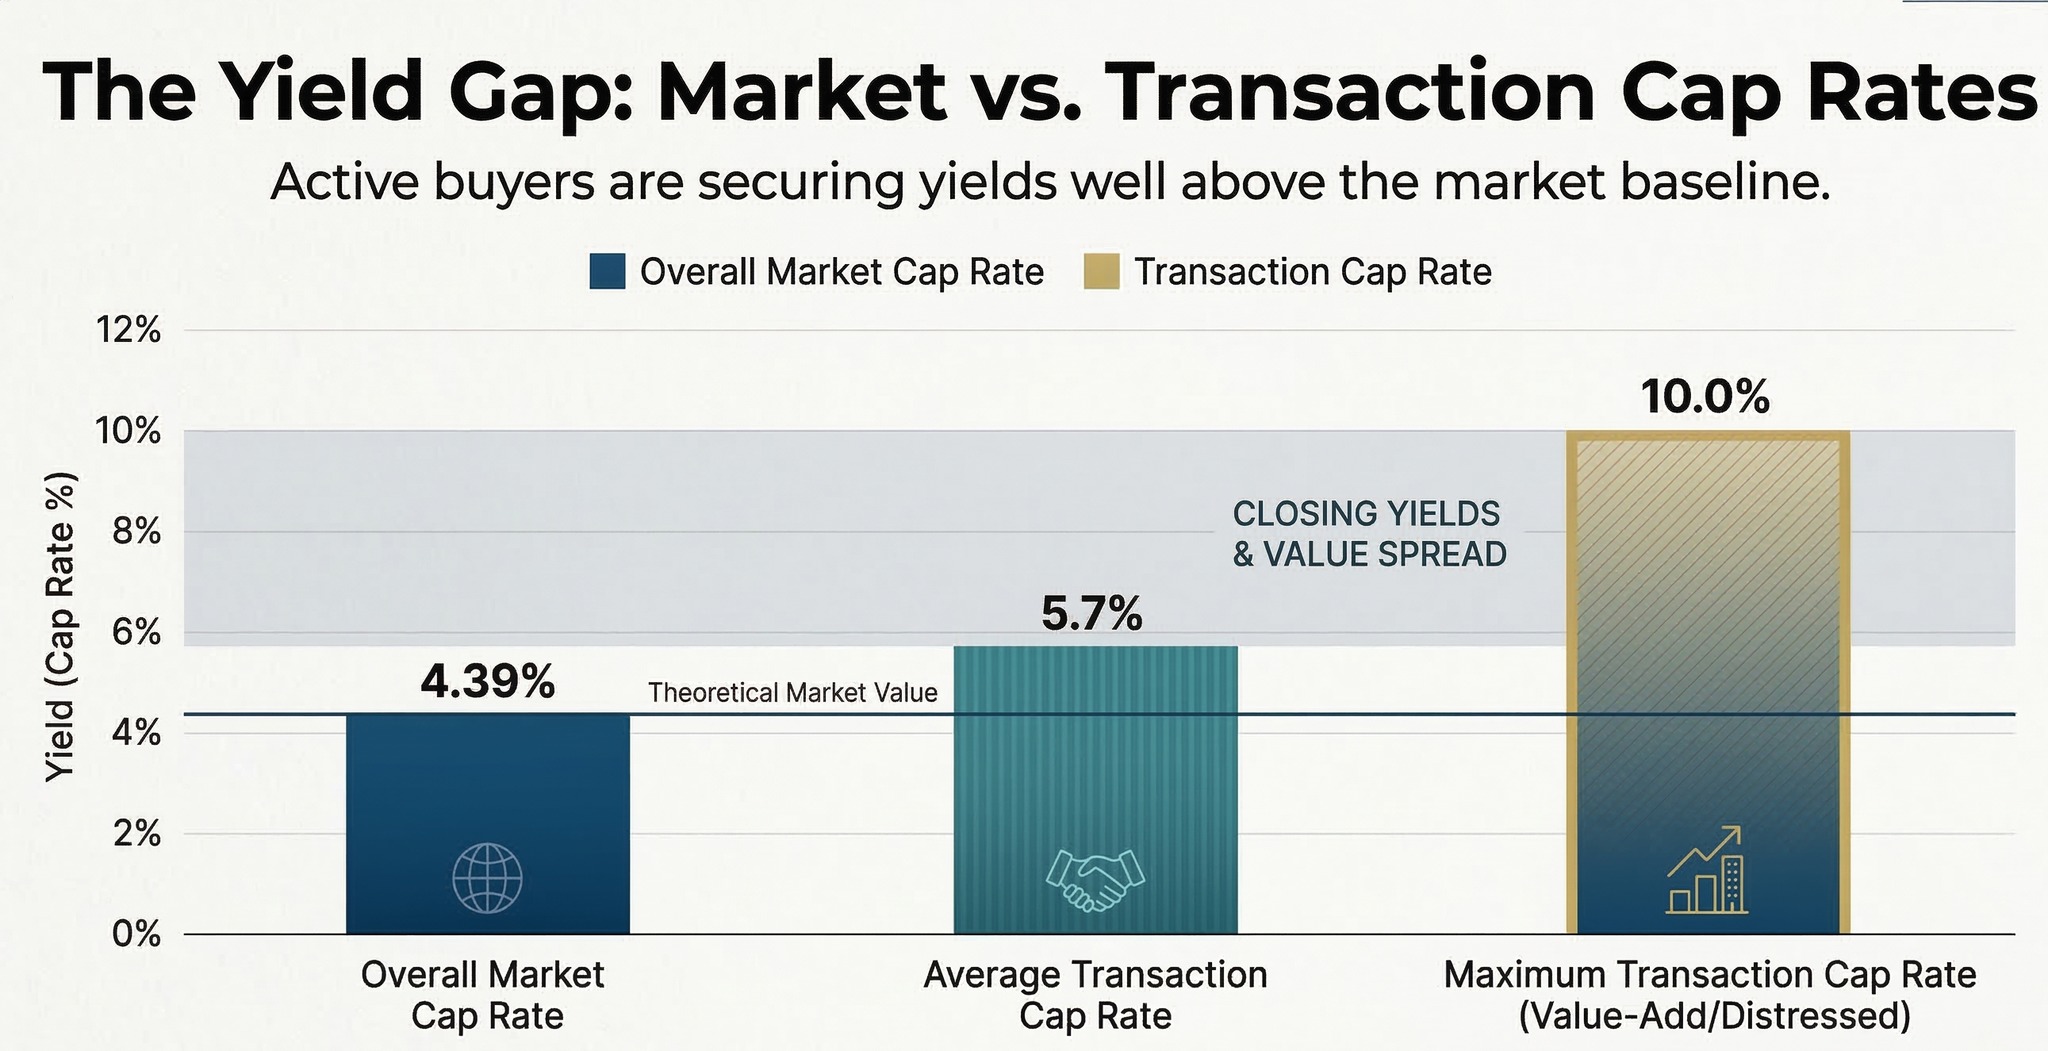
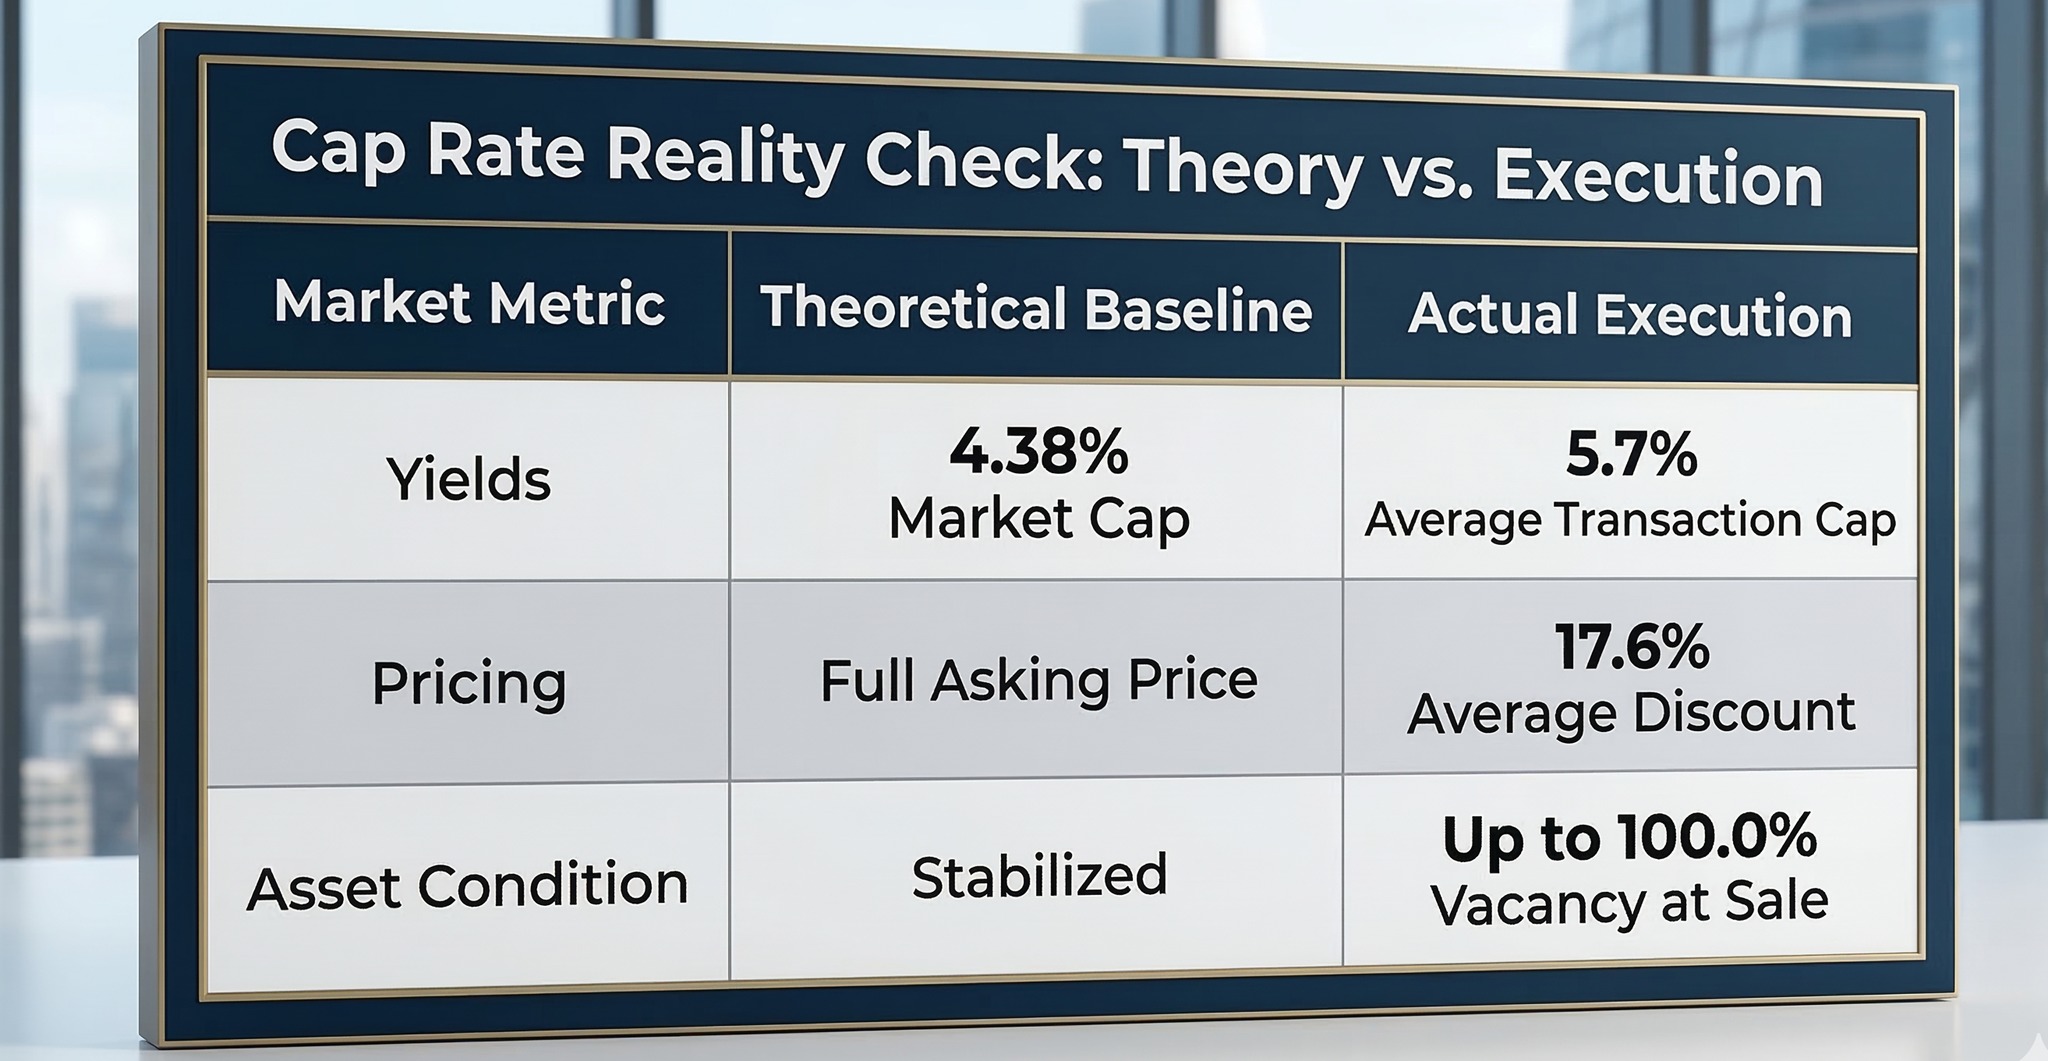
Example: In recent multifamily market data, the overall market cap rate hovered tightly between 4.38% and 4.39%. This tells us that a typical, stabilized, performing apartment building in this region is theoretically valued at roughly a 4.38% return.
The Reality Check: Transaction Cap Rates
The Transaction Cap Rate, on the other hand, is the actual, real-world yield on the specific properties that successfully traded hands during a given period. It strips away theory and looks exclusively at what buyers actually paid and the returns they locked in.
Example: Looking at the same market data, the average transaction cap rate stood at 5.7%, with individual deals varying widely from 4.0% all the way up to 10.0%.
Why is there a spread? (Real-World Examples)
When the average transaction cap rate (5.7%) is significantly higher than the overall market cap rate (~4.38%), it means buyers are securing better returns than the general market baseline. There are two main reasons driving this gap:
- Aggressive Buyer Discounts Because buyers currently hold the leverage in the market, they are refusing to pay top-dollar premium prices. If a buyer forces the purchase price down, their yield mathematically goes up.
- The Data Example: Recent sales data shows that the average property sold for 17.6% below its initial asking price. In extreme cases, buyers successfully negotiated discounts of up to 30%. By aggressively driving the purchase price down, these buyers are "buying right" and locking in an average 5.7% return in a market where the baseline yield is only 4.38%.
- The "Risk Premium" on Distressed Assets The transaction cap rates ranged up to a massive 10.0%. A 10% yield in a 4.38% market almost certainly indicates a distressed or value-add asset.
The Data Example: While the average vacancy rate at the time of sale was a healthy 5.1%, some properties were sold completely empty, with up to a 100.0% vacancy rate at the time of the transaction. When buyers purchase empty or struggling buildings, they demand a much higher yield to justify the risk, the lack of immediate cash flow, and the capital required to renovate and stabilize the asset. The sale of these high-yield, high-risk properties pulls the average transaction cap rate upward.
The Bottom Line
The spread between these two metrics tells a clear story about current market dynamics. The 5.7% transaction cap rate reveals that the properties actually changing hands right now are either heavily discounted by aggressive buyers or are riskier assets requiring a higher return. Meanwhile, the owners of premium, fully stabilized properties—the ones that would trade at the 4.38% market cap rate—are likely holding onto their assets rather than selling them at a discount.
Discuss Your Next Real Estate Move
 The multifamily market is shifting rapidly, and having the right data is only half the battle—executing the right strategy is what drives returns. Whether you are looking to expand your portfolio, underwrite a new opportunity, or list an existing asset, I am here to help you navigate the market with confidence.
Check out this article next