
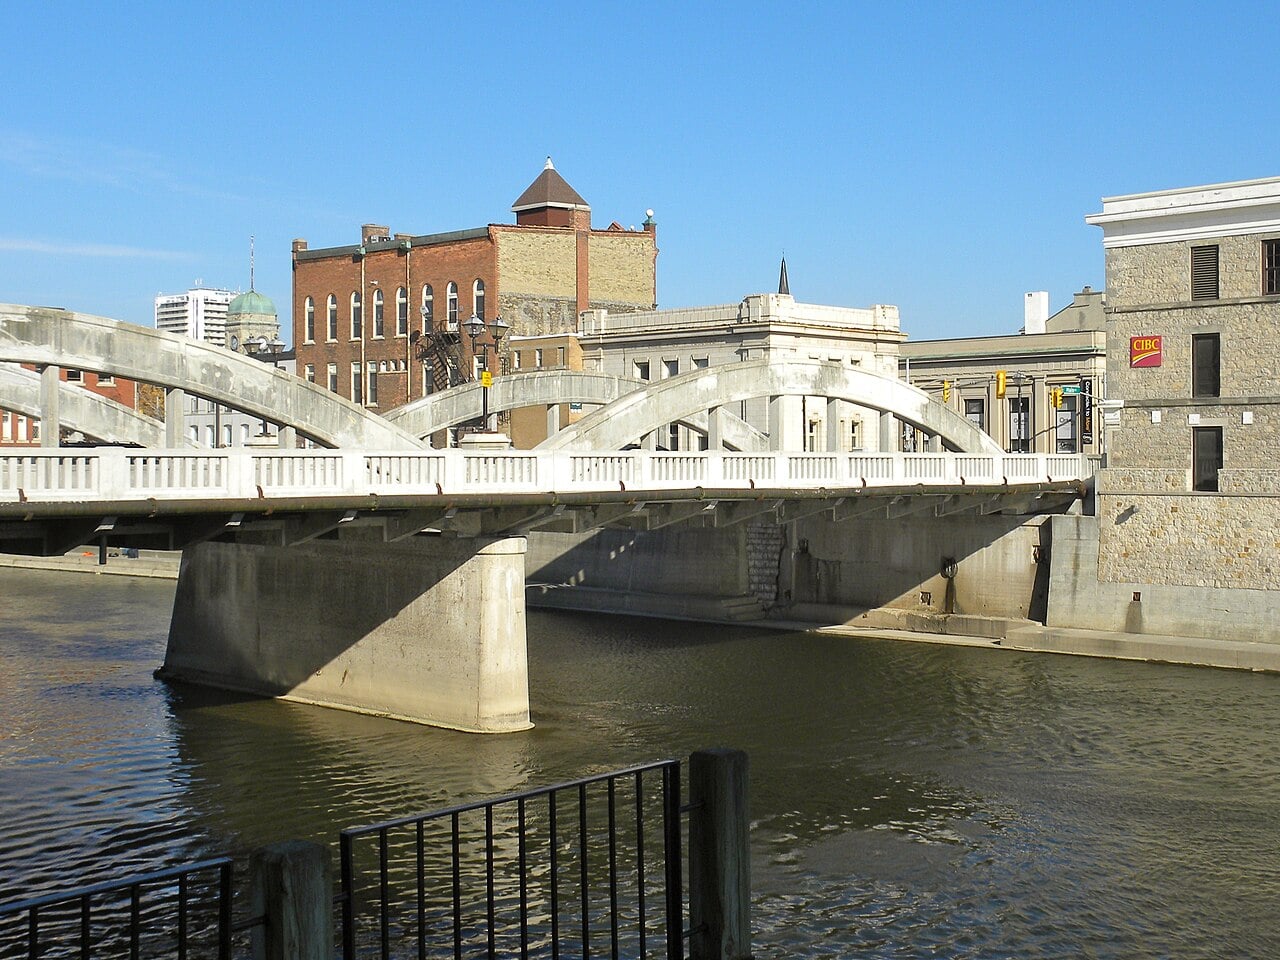
Photo: JasonParis, CC BY 2.0, via Wikimedia Commons
Cambridge is Waterloo Region's manufacturing city: the former towns of Galt, Preston and Hespeler, joined along Highway 401, with Toyota's assembly plants among its employers [1]. Three in ten households rent, household incomes run above the Ontario median [2], and the purpose-built rental stock is small and mostly more than 45 years old [3].
The short answer: for an owner planning to hold for five years or more, yes. Cambridge has higher household incomes than Kitchener, very little student exposure and a small rental stock, so the harder part is finding a building to buy. The numbers behind that answer follow, and the full verdict is at the end of this post.
This primer is for anyone thinking about buying, selling or holding a multi-family building in Cambridge. It leaves cap rates and this month's pricing aside and looks at what drives a building's income over a hold of five years or more: who rents here, what pays their rent, what the rental stock looks like, and which local rules and projects could change the math.
Note: Sources are cited with a number in square brackets, like [1], and listed with hyperlinks at the bottom of this post.
At a glance
- Cambridge had an estimated 165,354 residents on July 1, 2025, up 24.5% in ten years. Ontario grew 18.6% over the same period [4].
- 31.1% of households rent, in line with Ontario's 31.4% and well below Kitchener's 40.3% [2].
- Median household income was $93,000 in 2020, above Ontario's $91,000 [2].
- 18.6% of the labour force works in manufacturing, more than double Ontario's 8.9% [2].
- Unemployment in the wider area was 7.7% in September 2026, against 6.9% for Ontario [5].
- Consumer insolvencies in the Kitchener area, which includes Cambridge, ran at 3.1 per 1,000 adults in 2025, below Ontario's 3.9 [6][7].
- CMHC counts 6,819 purpose-built rental units. Vacancy was 3.4% in October 2025 and the average two-bedroom rent was $1,918, the highest of the region's three cities [3][8].
- 874 rental units were under construction in August 2026, about 13% of the existing stock [3].
- The City's licence list shows no licence for residential rentals, and Cambridge has no rental replacement by-law [9][10].
Where is Cambridge?
Cambridge sits on Highway 401 in the south-east corner of Waterloo Region. In a straight line it is about 20 km from both Kitchener and Guelph and about 80 km from downtown Toronto. It is the only one of the region's three cities without a train. GO bus Route 25 stops at Hespeler Road and Pinebush Road [11], and ION bus Route 302 links the downtown terminal to the light rail line at Fairway station in Kitchener [12].
The location shapes the tenant base. Of Cambridge residents with a regular workplace, 56% work inside the city, 16% work elsewhere in Waterloo Region and 28% commute to a job outside the region [2].
Who rents in Cambridge?
At the 2021 Census, 15,955 Cambridge households rented, or 31.1% of the total. That is in line with Ontario's 31.4% and well below Kitchener's 40.3% [2]. The share has risen at every count: 27.1% in 2011, 29.4% in 2016 and 31.1% in 2021 [13]. Between 2016 and 2021 the city added about 1,800 renter households and about 1,240 owner households, so roughly six of every ten new households rented.
Cambridge is more of a family city than a young-renter city. The median age is 39.2, between Kitchener's 37.2 and Ontario's 41.6. The average household has 2.7 people, and 57% of homes are single-detached houses [2]. Only 1.9% of residents were non-permanent residents in 2021, about half Kitchener's share, so the swing in international students that hit Kitchener and Waterloo matters less here [2].
Incomes are a strength. Median household income was $93,000 in 2020, above Ontario's $91,000 and Kitchener's $87,000 [2]. At the same count, 35.3% of tenant households spent 30% or more of their income on shelter, below Ontario's 38.4% [2]. Keep the date in mind. The average rent in CMHC's survey has risen about 50% since 2021, partly because new, higher-rent buildings joined the survey [3], and the next census income figures do not arrive until July 2027 [14].
The workforce is built around skilled trades and production. Among residents aged 25 to 64, 24.7% hold a bachelor's degree or higher, well below Ontario's 36.8%, while 33.2% hold a college diploma or trades certificate, above the province's 28.7% [2].
Is rental demand growing?
Over ten years, yes. Statistics Canada estimates Cambridge's population at 165,354 on July 1, 2025, up from 132,807 in 2015. That is 24.5% growth, against 18.6% for Ontario [4]. Growth ran at 5.3% in the year to July 2023 and 5.1% the year after, then dropped to 0.6% [4].
The pause is regional. Across the wider area, non-permanent residents (mainly international students and temporary workers) added more than 27,000 people in each of two years, then fell by 7,365 in the year to July 2025 [15]. My Kitchener primer, Is Kitchener a Good Place to Buy an Apartment Building?, covers that swing in more detail.
The long-range forecast still points up. The regional plan forecasts 214,900 residents in Cambridge by 2051, up from 146,000 in 2021 [16].
What pays the rent?
Manufacturing does, to a degree that sets Cambridge apart. At the 2021 Census, 18.6% of the resident labour force worked in manufacturing, against 16.1% in Kitchener and 8.9% across Ontario [2]. Statistics Canada counts 16 workplaces in the city with 500 or more employees, and eight of them are manufacturers [17].
Toyota is the anchor. Its plants in Cambridge and Woodstock employ more than 8,500 people [1]. Automation firm ATS is headquartered here, and Waterloo EDC also lists Rockwell Automation, BWXT, Honeywell Aerospace, Eclipse Automation, Dare Foods and Canadian General-Tower among the city's manufacturers [1]. Outside the plants, Cambridge Memorial Hospital finished a redevelopment in January 2025 that took it to 217 beds [18], and Conestoga College opened the second phase of its skilled trades campus on Reuter Drive in fall 2026 [19].
The job market has softened. Jobs data is published for the combined Kitchener-Cambridge-Waterloo area, which had 389,100 people working in 2025, up from 289,800 in 2015 [20]. Unemployment there ran about a point below Ontario's through 2018. By 2025 the two were level at 7.7%. In September 2026 the local rate was 7.7% against 6.9% for the province, after peaking at 9.0% in April [20][5].
Trade is the exposure to watch, and Cambridge has more of it than Kitchener. Statistics Canada estimates that 13.7% of jobs in the Kitchener-Waterloo-Barrie economic region depend on American demand for exports, against 9.3% nationally [21]. CMHC describes the area as one of Ontario's most tariff-exposed economies because of auto and parts manufacturing [8]. The City reported in August 2026 that industrial inquiries were still largely about business expansion, despite what it called a challenging trade environment [22]. I look at what the dispute means for local owners in Trade Wars, CUSMA and Your Apartment.
How financially healthy are Cambridge's tenants?
A rent roll is only as good as the tenants' ability to pay. No public source measures that for one city's renters, so I read four official indicators together.
Start with insolvencies. The Office of the Superintendent of Bankruptcy counted 3.1 consumer insolvencies (bankruptcies plus consumer proposals) per 1,000 adults in the Kitchener area, which includes Cambridge, in 2025. That was down from 3.4 in 2024 [6]. Ontario was at 3.9 and Canada at 4.1 [7]. Among the ten Ontario metropolitan areas covered in this series, only Guelph was lower at 3.0 [6]. A rate for Cambridge alone is not published, and the figure covers all adults, owners and renters alike, so read it as a gauge of household financial stress in the area, not as a tenant default rate.
The census adds a view of renters specifically. In 2021, 21.1% of Cambridge tenant households were in core housing need, against 24.9% across Ontario. The share living in subsidized housing was 14.3%, slightly above Ontario's 13.7% [2].
CMHC also surveys rent arrears, but it does not publish a figure for the Kitchener-Cambridge-Waterloo area. Across Ontario, 12.3% of purpose-built rental units had some rent in arrears in 2025, down from 14.3% in 2024, and the amount in arrears was 0.8% of the rent owed, down from 1.2% [23].
Put together, Cambridge's tenant base looks sturdier than the Ontario norm on debt and affordability, and more exposed on jobs because so much of the work is in manufacturing. These are city-level gauges for pricing risk. They say nothing about any one applicant, and a regulation under Ontario's Human Rights Code sets out what a landlord may ask for and consider when choosing a tenant [24].
What does the rental stock look like?
Cambridge's purpose-built rental stock is small. CMHC counted 6,819 units in October 2025, against 24,116 in Kitchener and 10,993 in Waterloo [3][8]. About 65% were built before 1980, and almost all of those date from 1960 to 1979. Close to half of the apartment units are in buildings of 50 to 199 units, and CMHC's count shows none in buildings of 200 units or more [3].
Vacancy sat near or below 2% from 2015 to 2022 and touched 1.2% in 2021. It rose to 4.9% in 2024 as about 500 new units entered the survey, then eased to 3.4% in 2025, close to Ontario's 3.2% [3]. CMHC grades its recent Cambridge estimates below its usual reliability rating, and marks the 2024 figure "use with caution", so treat the direction as more dependable than the decimals. Rents nearly doubled over the decade. The average two-bedroom went from $978 in 2015 to $1,918 in 2025, and the average increase on units surveyed in both years was 4.9% in 2025 [3].
At $1,918, Cambridge's average two-bedroom rent is the highest of the region's three cities, ahead of Waterloo at $1,901 and Kitchener at $1,747 [3][8].
Age of building drives rent here as it does everywhere. A two-bedroom in a building from 1960 to 1979 averaged $1,602. In a building from 2000 or later it averaged $2,281, and in buildings finished since mid-2022 it averaged $2,544 [3][8]. Vacant two-bedroom apartments were asking an average of $2,229 in October 2025, against $1,970 for occupied ones [8].
Rent control explains the gap. Ontario's guideline (2.1% for 2026 and 1.9% for 2027) does not cover units first occupied after November 15, 2018, and it does not apply when a unit turns over [25]. For the notice rules and exemptions in detail, see How Ontario Residential Rental Increases Work. CMHC does not publish how many units are exempt. As a rough guide, its count of Cambridge units in buildings from 2000 or later grew by 550 between October 2018 and October 2025, equal to about 8% of today's stock [3]. In the older stock, turnover is where rent resets, and 15.3% of Cambridge apartments turned over in the year to October 2025, up from 11.7% the year before [8].
New supply has been thin for years and is now arriving in a lump. Cambridge saw no rental starts at all in 2019 and 2020, and between 130 and 211 a year from 2021 to 2025. Then builders started 688 rental units in the first eight months of 2026, including 606 in February alone [3]. The City's permit records show about 600 apartments in a single three-tower project [22]. In August, 874 rental units were under construction, about 13% of the existing stock [3]. CMHC forecasts vacancy across the wider area at 4.5% in 2026 and 4.7% in 2027 and 2028 [26].
What are the local rules and costs?
On the rules, Cambridge asks the least of landlords among the region's three cities. The City's licence list covers businesses and shows no licence for residential rentals [9]. Kitchener has a rental replacement by-law and a renovation licence that starts in 2027, and Waterloo has a comprehensive rental licensing by-law, which I cover in Waterloo's New Rental Licensing Bylaw: The 2026 Landlord's Guide. I found neither a rental replacement by-law nor a renovation licensing by-law in Cambridge's Council records. Council did direct staff in April 2025 to study rental replacement, with a five-unit threshold, so that may change [10]. Inclusionary zoning is on hold, with no set-aside rates adopted [27].
Zoning has been loosened. A new zoning by-law for residential areas took effect in February 2026. Its R3 zone allows buildings of up to 5 storeys on local roads and 15 storeys on collector and arterial roads, though parking minimums remain [28]. In August 2026 Council adopted a plan for the Hespeler Road corridor that allows up to 25 storeys around three future light rail stations [29].
Building here is expensive. The City charges $24,141 in development charges on an apartment with two or more bedrooms and $13,111 on a smaller one. Add the Region's $23,570 and a new two-bedroom apartment carries about $47,700 before the rental discounts of 15% to 25%. Rental projects can pay in six annual instalments from occupancy [30]. In September 2026 Council voted 7 to 2 to decline a provincial offer under a program that would have reduced the City's charges [31]. The core area incentives have also ended: the Core Areas Community Improvement Plan closed to applications on December 31, 2025, and the core area development charge exemption is exhausted [32]. For owners of existing buildings, a high cost to build new is a form of protection.
On the operating side, older buildings in the multi-residential tax class pay a 2026 rate of 2.80341%, about 1.85 times the residential rate of 1.51218%. Buildings in the new multi-residential class pay the residential rate [33].
What could change the picture?
Water is a narrower constraint here than next door. The Region's capacity shortfall, identified in December 2025, is in the Mannheim Service Area, which supplies Kitchener, Waterloo and only parts of Cambridge [34]. Cambridge adopted a Water Allocation Policy in July 2026 for the affected area. Projects there need a water allocation before site plan approval or a building permit, and allocations are released quarterly [34]. Check the City's map before you buy a development site. My guide to Ontario Archaeological Assessments covers another condition that can hold up a site.
Transit is promised, not funded. Regional Council approved extending ION light rail 17 km from Fairway station to downtown Cambridge in November 2025, with seven stations and an estimated cost of $3.13 billion. There is no funding and no construction date [12]. A separate proposal for passenger rail between Cambridge and Guelph, connecting to the Kitchener GO line, carries a capital estimate of $440 million to $550 million, and Regional Council asked Metrolinx in 2024 to take it forward [35]. The Province plans to widen Highway 401 through Cambridge from six to ten lanes, with a target of 2028 to 2029 [36].
New housing is running behind target. Cambridge's provincial target is 19,000 new homes by 2031, and it reached 43.6% of its annual target in 2025 [37]. Council approved planning applications for 2,633 units in 2025 and 4,930 in 2024, so approvals are well ahead of construction [38].
The risks are a trade dispute that reaches the plants, a lump of new rental supply landing in a small market, and transit projects that slip.
The Cambridge scorecard
Here are the main numbers from this primer in one place, each with something to compare it to.
So, is Cambridge a good place to buy an apartment building?
For an owner planning to hold for five years or more, yes. Cambridge has a well-paid tenant base, an old rental stock that is costly to replace, and fewer local rules than its neighbours. Its weak points are a heavy reliance on manufacturing and a market so small that one large project moves the numbers.
What works in its favour:
- Incomes and stability. Median household income is above the Ontario median, and the city has little exposure to the swing in international students [2].
- Tenant finances. Consumer insolvencies in the wider area run below the Ontario rate, and a smaller share of tenants is in core housing need than across the province [6][7][2].
- A small, old stock that is expensive to replace. There are 6,819 purpose-built units, 65% of them built before 1980, and a new two-bedroom apartment carries about $47,700 in development charges before discounts [3][30].
- Rent upside on turnover. Vacant two-bedroom apartments ask about $260 more than occupied ones, and 15.3% of apartments turned over last year [8].
- Light local regulation. No residential rental licence and no rental replacement by-law [9][10].
What to watch:
- Manufacturing. It employs 18.6% of the labour force and accounts for eight of the sixteen largest workplaces [2][17].
- A lump of supply. 874 rental units are under construction, about 13% of the stock, most of them in one project [3][22].
- A thin market. With fewer than 7,000 purpose-built units there are simply fewer buildings to buy, and CMHC's estimates here are less reliable than in larger cities [3].
- Transit on paper. Light rail and passenger rail are approved or proposed, not funded [12][35].
Who it suits. Buyers of older low-rise and mid-rise buildings who price on the income in place, plan to hold, and can wait for the right building. It is a harder market for an investor who needs scale quickly, or for leasing up new units while 874 are under construction. This is a general view of the market, not advice on any particular property.
What it means for buyers, owners and sellers
For buyers. Expect to wait for a building and to compete for it when it appears. Underwrite the rent roll that exists, and treat the gap to asking rents as upside you cannot schedule. Check each unit's rent control status, and for any site with redevelopment potential, check the water service area first.
For current owners. Retention and paperwork matter most. Serve the N1s. I work through what a skipped increase costs in cash flow and sale price in The N1 You Skipped Is Still Costing You. With turnover at 15.3%, each vacancy is a chance to reset rent, but new buildings will be competing for the same tenants through 2027.
For sellers. A small market can favour a seller with a clean file. A complete rent roll, N1 records and a clear answer on each unit's rent control status let a buyer price the income with confidence.
Frequently asked questions
Is Cambridge a good place to invest in apartment buildings?
For owners planning to hold for five years or more, the fundamentals are solid: household incomes sit above the Ontario median, the population grew 24.5% in ten years, the purpose-built rental stock is small at 6,819 units, and the City has no residential rental licensing. The risks are a heavy reliance on manufacturing, 874 rental units under construction as of August 2026, and a small market where few buildings come up for sale.
What is the rental vacancy rate in Cambridge, Ontario?
Canada Mortgage and Housing Corporation measured the purpose-built rental vacancy rate in the City of Cambridge at 3.4% in October 2025, against 4.9% in 2024 and 1.2% in 2021. CMHC grades its recent Cambridge estimates below its usual reliability rating. It forecasts 4.5% for the wider Kitchener-Cambridge-Waterloo area in 2026.
What is the average rent for an apartment in Cambridge?
In CMHC's October 2025 survey the average two-bedroom rent in purpose-built rentals in the City of Cambridge was $1,918 a month, and the average across all unit sizes was $1,857. Two-bedroom units in buildings from 2000 or later averaged $2,281, against $1,602 in buildings from 1960 to 1979.
Do landlords need a rental licence in Cambridge?
The City of Cambridge's licence list covers businesses only and shows no licence for residential rentals. As of October 2026 the City has no rental replacement by-law in force, though Council directed staff in April 2025 to study one, and its inclusionary zoning work is on hold.
Are apartment buildings in Cambridge under rent control?
Yes, under Ontario's rules. The rent increase guideline is 2.1% for 2026 and 1.9% for 2027. Units first occupied for residential purposes after November 15, 2018 are exempt from the guideline, and the guideline does not apply when a unit turns over to a new tenant.
Is Cambridge's population still growing?
Slowly. Statistics Canada estimates the City of Cambridge had 165,354 residents on July 1, 2025, up 0.6% in a year after growth of 5.3% and 5.1% in the two years before. Over ten years the city grew 24.5%. The regional plan forecasts 214,900 residents by 2051.
Is light rail coming to Cambridge?
It is approved but not funded. In November 2025 Regional Council approved a 17 km extension of the ION light rail line from Fairway station in Kitchener to downtown Cambridge, with seven stations and an estimated cost of $3.13 billion. There is no construction date. Today ION bus Route 302 links downtown Cambridge to the light rail line at Fairway.
About the Author: Terry Riddoch, Ontario Multi-Family and Commercial Real Estate Broker
Terry Riddoch is a licensed Ontario real estate broker with Re/Max Real Estate Centre, based in Waterloo Region and specializing in multi-family and apartment building sales across Ontario. With 19 years of experience and over $90 million in closed transactions, he advises independent landlords, private investors, and national investment groups on buying, selling, and valuing apartment buildings, investments and development land across the Province of Ontario including Waterloo Region (Kitchener, Waterloo and Cambridge), Guelph, Brantford, Hamilton, London, Milton, Windsor, Kingston, Belleville, Brockville and Sudbury.
Clients know Terry for candid advice, data-driven analysis, and doing the work well ahead of the deal. He writes regularly on Ontario landlord rules, rent control, the Landlord and Tenant Board, and housing policy to help property owners make informed decisions.
Thinking about selling an apartment building, or looking for your next investment property? Call Terry at (519) 591-1725, email [email protected], or visit terryriddoch.ca for a confidential, no-obligation conversation about your property.
Sources
- Waterloo EDC, Region spotlight: Cambridge, Major auto manufacturers that call Canada home and Biggest manufacturing companies in Waterloo.
- Statistics Canada, Census Profile, 2021 Census of Population: Cambridge (City), Kitchener (City) and Ontario. Incomes are for 2020.
- Canada Mortgage and Housing Corporation, Housing Market Information Portal, City of Cambridge: Rental Market Survey (October 2015 to October 2025) and Starts and Completions Survey (to August 2026).
- Statistics Canada, Table 17-10-0155-01, Population estimates, July 1, by census subdivision, released January 14, 2026. The 2025 figure is preliminary.
- Statistics Canada, The Daily: Labour Force Survey, September 2026, released October 9, 2026, and Table 14-10-0459-01 (census metropolitan areas, three-month moving averages).
- Office of the Superintendent of Bankruptcy Canada, Annual Consumer Insolvency Rates by Census Metropolitan Area, updated July 28, 2026. Rates per 1,000 residents aged 18 and over.
- Office of the Superintendent of Bankruptcy Canada, Annual Consumer Insolvency Rates by Province and Economic Region, updated July 28, 2026 (Ontario and Canada).
- Canada Mortgage and Housing Corporation, 2025 Rental Market Report, December 11, 2025, with the Rental Market Survey Data Tables for Kitchener-Cambridge-Waterloo.
- City of Cambridge, Licensing.
- City of Cambridge, Council minutes, April 15, 2025 (rental replacement by-law feasibility study).
- GO Transit, Route 25 timetable (Table 25), effective September 5, 2026.
- Region of Waterloo, Stage 2 ION and Regional Council approves extending light rail to Cambridge (November 19, 2025); Grand River Transit, ION light rail.
- Statistics Canada, Census Profile, 2016 Census, and National Household Survey Profile, 2011: Cambridge (City), households by tenure. The 2011 survey was voluntary.
- Statistics Canada, 2026 Census of Population: key content release schedule.
- Statistics Canada, Table 17-10-0149-01, Components of population change by census metropolitan area, released January 14, 2026.
- Region of Waterloo, Regional Official Plan Amendment No. 6, Table 1, adopted August 18, 2022 (population and employment forecasts to 2051).
- Statistics Canada, Table 33-10-1176-01, Canadian Business Counts, June 2026 (City of Cambridge).
- Cambridge Memorial Hospital, CMH celebrates completion of its capital redevelopment, January 2025.
- Conestoga College, Cambridge: Skilled Trades Campus, Reuter Drive.
- Statistics Canada, Table 14-10-0461-01, Labour force characteristics by census metropolitan area, annual, and Table 14-10-0464-01 (Ontario).
- Statistics Canada, United States tariffs and Canadian labour market trends, October 29, 2025.
- City of Cambridge, Building Permit Statistics, second quarter 2026 (IM26-013), August 7, 2026.
- Canada Mortgage and Housing Corporation, Rental Market Survey Data Tables, Canada, Table 5.0, Rental Arrears: 2025 edition and 2024 edition.
- Government of Ontario, Ontario Regulation 290/98 under the Human Rights Code: Business Practices Permissible to Landlords in Selecting Prospective Tenants for Residential Accommodation.
- Government of Ontario, Residential rent increases, updated June 23, 2026.
- Canada Mortgage and Housing Corporation, Summer Update: 2026 Housing Market Outlook, July 22, 2026.
- City of Cambridge, Inclusionary Zoning Update (IM26-011), June 12, 2026.
- City of Cambridge, Zoning and report 25-034-PG (Zoning By-law 26-007, in effect February 3, 2026).
- City of Cambridge, Hespeler Road Corridor Secondary Plan, report 26-066-PG, adopted by Council August 25, 2026.
- City of Cambridge, Development Charges brochure (rates effective December 1, 2025 to November 30, 2026) and report 26-004-CFS (payment timing); Region of Waterloo, Regional Development Charges.
- City of Cambridge, Council minutes, September 15, 2026 (development charge reduction program).
- City of Cambridge, Core Areas Community Improvement Plan update (IM26-002-CS) and report 26-081-PG, September 15, 2026.
- City of Cambridge, Taxes (2026 property tax rates).
- City of Cambridge, Water Supply Allocation; Region of Waterloo, Mannheim Service Area: information on development.
- Region of Waterloo, Cambridge to Union Passenger Rail.
- Government of Ontario, Ontario Highways Program, summer 2026.
- Government of Ontario, Ontario's housing supply progress; City of Cambridge, Building Faster Fund Update (IM26-014), September 4, 2026.
- City of Cambridge, 2025 Year in Review, April 2026.
Figures are current to October 9, 2026. "Wider area" means the Kitchener-Cambridge-Waterloo census metropolitan area. Percentages, growth rates, shares and straight-line distances not stated in a source are calculations by Terry Riddoch from the figures cited.
Check out this article next